

The Monthly Pulse – August 2026
Welcome to Packed Planet’s inaugural Monthly Pulse – your source for insights, emerging technology and strategies designed to help you maximize the performance of your store. We hope you enjoy it.
Revenue Management: The New Profit Engine
Pricing is one of the fastest ways to improve performance at your facility – but it’s also one of the most commonly neglected. Many operators set rates once and let them ride, missing daily opportunities to capture more revenue or increase occupancy. The truth is, your pricing strategy doesn’t need to be complicated to be effective – it just needs to be intentional.
With just a few quick adjustments focused on availability, demand signals, and competitive positioning – you can dramatically improve both conversions and revenue. In fact, many operators can identify and correct pricing gaps in a matter of minutes once they know where to look and what to prioritize. Click below to read the full article.
Recent Releases
 Meet Eugene: Custom built AI bot in NOA, Eugene puts company knowledge, FMS guidance and business data at employees’ fingertips thru natural conversation. Ask, “What are the steps for certifying a unit for auction?” and get the information you need in seconds. Eugene can have natural conversations while helping customers retrieve access codes, check balances, make payments, find storage, and more. It’s our next step toward smarter, 24/7 customer service. Eugene is available now in all Management Plans, as well as NOA+ Self Management & NOA Enterprise beginning this Fall.
To schedule a discussion for placing Eugene at your store ➜ Click Here

Analysis
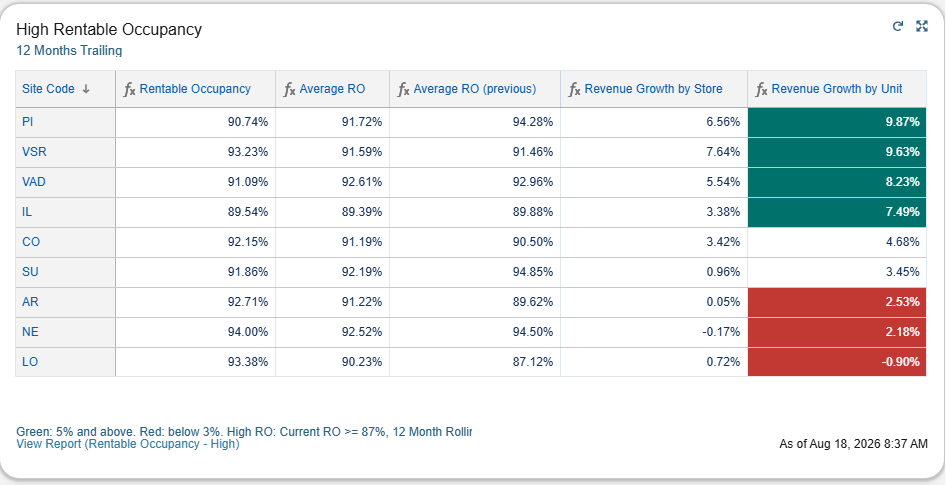
Setting the table: RO is what we call Rentable Occupancy (which removes any unit not rentable from the equation such as units reserved or out of service). Revenue Growth by Store is the percentage of revenue changed across the store (the common KPI used by most everyone) while Revenue Growth by Unit removes occupancy fluctuations and measures revenue changed across the rented units. This focuses on how the units that are rented are being impacted by our revenue Management.
In the image above, we have our stores in common groups by RO. For this example, the group in the image consists of stores that have maintained a High RO over the past 24 months. For the top line, PI (our store abbreviation code), we increased the store’s revenue Year over Year by 6.56% despite Rentable Occupancy falling by 3 1/2 points. This is supported by the Revenue Growth x Unit increasing 9.87%. Without strong revenue management, this store’s revenue growth by store would have most likely seen a decrease in Year Over Year revenue. Not every store sees the same trends. Looking at the last line, store LO, we saw a decrease in revenue despite Rentable Occupancy increasing by 6 points. For this store, this was due to aggressive revenue pushing to match strong competition in the area.
If you’d like to discuss this or any other KPIs, please reach out. we’d love to continue the conversation.
